How to Track Poker Results Using a Poker Log Excel
Even honest poker players tend to distort the truth about their poker results from their sessions. Without keeping a poker log, it can be really easy to lose track of actual poker winnings and know exactly how well you’re doing at the tables.
-
T&Cs Apply | Play Responsibly | GambleAware
18+ | Play Responsibly | T&C Apply
-
T&Cs Apply | Play Responsibly | GambleAware
T&Cs Apply | Play Responsibly | GambleAware
Without having an online or live poker results database for all the sessions you’ve played, you can’t truly analyze your game. You need to understand where you make your money and how much money each aspect of your game makes you. Anyone who plays poker often enough should keep detailed poker records of their sessions.
How Much Do You Really Win at Poker?
Most poker players in fact don’t even have an actual bankroll management spreadsheet – they just split between real-life needs and their playing money. Just having a poker bankroll spreadsheet noting how much you come into the poker room with and how much you leave the poker room with isn’t an accurate representation. Do you crush $1/$2 for $30/h, but only beat $2/$5 for $15 an hour? It may be a bigger game with more money in play, but if you’re not making as much money, why play it?
Almost all winning poker players become losing players at some specific limit. If the only live poker game tracking you do is your poker bankroll management excel numbers, you’ll never know which limit is a money pit for you. Example: If you make $20/hour playing a $5/$10 game but lose $10 an hour playing $10/$20, as long as you play more hours of $5/$10 during the month at the end of it you’ll end up with a profit. Because you see the month as being in the black you’ll continue to play $10/$20 without realizing how much money it’s costing you to do so.
Example:
Imagine you jump into a $2/$5 session holding A K under the gun. You raise and face multiple callers, including an aggressive player in position. After a few streets of betting, you walk away with a moderate pot. At first glance, you might record this as a winning session. However, if you don’t take notes on your buy-in size, total hours played, and how each limit affects your ROI, you could overlook more subtle leaks in your game—like losing bigger pots later on to that same aggressive player, offsetting your earlier gains.
Related Reading:
More on How Not to Suck at Poker:
How to Keep Proper Poker Records
Pick your own poison:
- Poker Excel Spreadsheet or notepad
- In-app poker track tools, like a PokerStars log
- iPhone app (like Hot Poker Log)
Essential Poker Reports
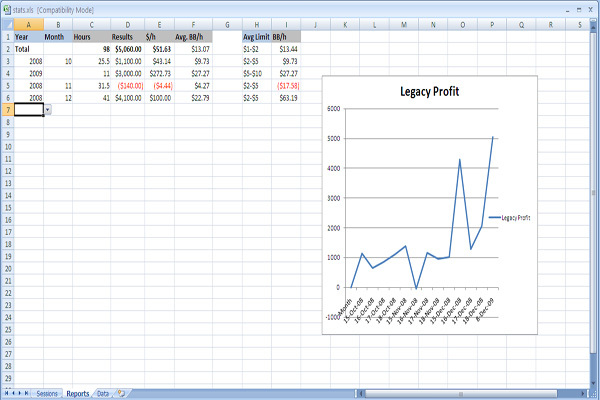
- Legacy Results (A running total of profit/loss for all results)
- Monthly Results
You may also want to know how much you make per hour, how much you make per hour at a specific limit, your BB/hour or even what poker site you make the most money on. On this page, you can see an example of an Excel poker sheet set up to keep track of the essential poker information.
You can have the program run reports for specific months, limits, and dates. You can even have it automatically generate a graph from your legacy profits (see example picture below). Even though poker stats won’t help you at the table directly, knowing where your strengths and weaknesses lie will indirectly help you make more profitable choices at the Texas Hold’em tables.
What Poker Results to Track
There is really no one right way to keep your poker records. The more information you record and track while playing poker, the more interesting reports you can create. It’s up to you to decide how deep you want to go. Regardless, some poker log items are vital for all players to track poker winnings:
- Date
- Hours at the table (start time + end time)
- Limit
- Total buy-in amount (including all top-ups and rebuys)
- Total cash-out amount
These poker records let you see your profits/losses, hourly rate, BB/hour ratio, yearly trends (what months are more or less profitable) and how many buy-ins deep you go in on average. If you’re a casual player, this first set of poker results will do you just fine. If you want your records to be more informative, you can also keep track of:
- Location
- Variant
- Specific players at the table
- Day of the week
- Time of day
- Mood
Recording this data will help you figure out:
- Where you make the most money
- Which days of the week/times of day you tend to play best
- How your mood affects your poker results
- How specific opponents affect your poker results
- Which variants are most profitable for you
How to Keep Track of Your Own Hands Playing Live Poker
The best way to track live poker stats is to first write them down on your phone while at the table. When you get home put them into an Excel poker sheet, or just through an Excel app on your phone right away. This makes it simple to get instant reports and allows for more in-depth analysis.
Example:
Suppose you’re playing a $1/$3 cash game and you’ve been at the table for 6 hours. You had an early triple-up with J J on a connected flop, but an hour later lost a large portion of that to an aggressive opponent holding A K who turned an ace. By the end of the night, your profit was smaller than you remembered. Recording the initial surge and subsequent loss in your phone helps you see exactly how each sequence of hands impacted your total winnings.
If you’ve never done live poker tracking using Excel before there’s no better time to start. Once you have even a rudimentary knowledge of the program you can start to create your stat-tracking poker spreadsheet. No need for any special live poker results tracker. Here’s an example of a very simple stat-tracking setup:
| A | B | C | D | E | F | G | |
| 1 | Date | Hrs | Limit | Buy-in | Cash-Out | Result | $/h |
| 2 | 15-Oct-08 | 4 | $2-$5 | $1,000 | $2,150 | $1,150 | $143.75 |
The first five columns (A-E) need to be filled out by you but the last two can be populated by Excel automatically. To do that, you’ll need to put a formula into each field. If you click on a field and enter an equal sign into that field Excel will discern that you’re creating a formula.
- Result: =SUM(E2-D2)
- $/h: =PRODUCT(F2/B2)
Now when you add a new row of data into row three all you have to do is highlight the column with a formula you want to reuse, copy it and paste it into the new cell. bBetter yet you can use the Fill Down function. Use the mouse to select the cell with the formula, and all the cells below it you want the formula in, and hit CTRL-D (or use the “File” menu to select the option “Fill Down”). Now you have a simple poker excel sheet. To easily build other basic formulas use the built-in formula builders in Excel. All you have to do is follow the instructions, point and click.
How to Calculate BB/hour
If you want to get more advanced, do a little Googling and you can figure out how to run almost any report you can think of. For example, here’s the formula to calculate your BB/h (based on a table layout like the one above):
- =PRODUCT(_(F2/(RIGHT(C2,LEN(C2)-FIND(“*”,SUBSTITUTE (C2,”-“,”*”,LEN(C2)-LEN(SUBSTITUTE(C2,”-“,””)_)_)_)_)_)/B2)_)
*NOTE: All underscores ( _ ) need to be removed for this formula to work.
This formula is a fancy way of doing this: ((Result/BB)/Hours). All the stuff in the middle is just to get the big blind (or big bet if you’re playing limit) from the Limit field. If you had two fields (Low-Limit and High-Limit) this formula would be much simpler. Regardless of how you choose to do it, you should track online poker results of every session you
Tricks for Turning Excel into a Poker Results Tracker
A block of solid data can be hard to read at a glance. Since none of us want to spend time trying to comprehend this, here’s how to add some formatting to make your poker tracking spreadsheet easier to read.
Below you’ll see negative values are in red (done with standard formatting). But by using the conditional formatting tool, you can make it more obvious and change the red text to this:
To do this you need to highlight the cell(s) you want to format and choose “Conditional Formatting” from the main “Home” toolbar. Now we want to highlight the boxes if they’re negative, so choose “Highlight Cells Rule” then “Less Than.” Then put 0 in the text box and choose red as the color.
Using the Excel Drop Down Box
For some entries you only ever choose one from a small selection of options. Rather than type these in each time (which can result in formatting errors and typos, which can break calculation codes), we can create a drop down box with your selection choices. The easiest way to do this is to use a named range. The first thing you need to do is click on a tab at the bottom of your poker cash game spreadsheet to go to a new page of the same document. As you can see our document has three parts:
- Sessions
- Reports
- Data
We want to focus on the data page for this task. The first thing you want to do is create a list with all the values you want. Even though it’s not required I recommend you do the same. Click on the column header and where it says B1 write in the name of that list; I chose Limits for the Limits List. Now go back to the sessions tab. Click on the box (or boxes) where you want the drop down and choose the data tab from the main toolbar. Click on the option named “Data Validation.”
From here change the Allow field to “List” and in the source box write =Limits. If you named your range something else replace =Limits with =Whateveryouchoseasyourname. Now you’ll have a dropdown with everything in that named range. If you like you can enter an input message when in the data validation dialog box. That will show up like this:

Conditional Equations, or IF Statements
Here’s how IF statements work in Excel: =IF(condition,output if true, output if false). Here are some other things you need to know:
- = : Equal to
- <> : Not equal to
- “” : Null, or no input
- AND(condition1,condition2) : Both conditions must be true to return a true result
- OR(condition1,condition2) : Either of the conditions must be true to return a true result
So, using the result field as my example, the equation in the box reads as:
=IF((AND(F2<>””,G2<>””)),(G2-F2),””)
This means that if both F2 and G2 have anything in them (they <> (do not equal) “” (blank)) then output G2 minus F2 to give us our result. If either box is empty, a standard formula will return an error, so with this IF statement it returns “” (blank) instead. Excel is able to do very detailed equations, in my Reports page I use nested IF statements, such as this:
=IF(B4<>””,(SUMIF(DatePlayed,B4,Results)/SUMIF(DatePlayed,B4,Hours)),IF(A4<>””,(SUMIF(YearPlayed,A4,Results)/SUMIF(YearPlayed,A4,Hours)),””))
As you can see, you can make it as complex as you like, depending on how fancy you want to get. The SUMIF function is a pretty useful little tool. Here’s how it works:
=SUMIF(range to pick from, condition, range to add up)
Range to pick from – range of cells to use in formula, typically A2:A11, or a named range like I used.
Condition – Anything you want. If you wanted just results for one limit your condition would be “$2-$5”.
Range to Add Up – This is what actually gets added. The range to pick from are dates, but we want to add up the results for those dates.
As you might have expected this is only scraping the surface of what you can do with the program. But for formatting online or live poker stats, this is about all you need to know. If you have any questions, drop them in the comments and I’ll see what I can do.
Avoid the Spots That Cost You Money
At the very least you should be keeping track of how much you bought in for and how much you left with. As well as having a running total of all-time losses vs poker winnings tracker in your excel. Taking it one step further you should track things like when and where you’re playing and what kind of opponents and games you were in. By looking closely at these stats you’ll be able to focus on your strengths and avoid the spots that are costing you money.
Make a point of taking a few notes on your phone right after you finish every poker session. Then, on a weekly or monthly basis transfer that info to a cash game or poker tournament results spreadsheet. Once you get into taking more detailed records, Excel will help you organize and analyze all the information.
Related Reading:
Top Six Sickest Online Poker Graphs
The best part about online poker, compared to live, is that if you want to know someone’s lifetime poker results it’s pretty easy to find out. In live poker people win and lose money all the time and no one’s really keeping track (sorry IRS). But online you can bring up a player’s lifetime graph in a matter of seconds if you know the right places to look. Here at www.pokerlistings.com we know all the right places to look. We’ve used our know-how to bring you the sickest graphs of all time. Let’s get started.
Isildur1

Yes, the famous Viktor “Isildur1” Blum. First we have the infamous $5 million upswing (mostly thanks to Tom Dwan) followed by the $6 million downswing (most of it thanks to Brian Hastings). And last we have his most recent foray into the high stakes cash games. When isildur finally does go completely broke he can charge admission to ride the rollercoaster that is his graph.
Nanonoko

Randy Lew aka Nanonoko has one of the sickest, seemingly variance free, graphs of all time. It looks so smooth because the guy puts in more volume than any player in the world. He shipped over a million last year at middle stakes alone!
Joe “jcada99” Cada

Hrmm what do we have here? Some small stakes, some more small stakes, some more small stakes, oooh a tourney bink and Main Event final table! Cada followed that up with some (failed) shots at bigger games. According to his graph it didn’t work out very well for him
Richierichzh

Ben Grundy

Ben Grundy posted his PLO graph, showing the world he’s an a
Brian Hastings vs Isildur1

The biggest win in online poker in a single day belongs to Brian Hasti
Additional Methods
Modern poker analysis goes beyond simple profit-and-loss reporting. For professional players, using advanced data-management tools or scripting programs can yield deeper insights. Analyzing your play across multiple variables—such as player pool tendencies, time of day, or game format—provides a more nuanced understanding of your strengths and weaknesses.
Incorporating software-based solutions helps you manage separate databases for live and online games, track your mental state during sessions, and automatically annotate trends. By creating specialized dashboards (for instance, with pivot tables or custom macros), you can monitor your short-term and long-term growth, ensuring you adjust strategy in real time.
Merging Data and Strategic Adjustments
One key element of modern poker is using data sets to confirm or question your strategic assumptions. Whenever you notice that your win rate drops during particular hours, it might hint at lower energy levels or tougher opponents logging on at that time. By merging statistical analysis with consistent self-review, you reinforce discipline and keep your game plan aligned with profitable spots. You can also identify when certain lines—like three-barrel bluffs or overbet shoves—are working better in specific player pools.
Tracking these patterns allows for immediate adjustments. If you normally profit by isolating limpers, you can compare the EV of this line against alternative approaches—like flat-calling behind. By combining your spreadsheet data with session reviews, you keep pace with evolving meta-trends in both live and online environments.
Advanced Data Visualization
Enhancing your poker spreadsheet with advanced visualization features can sharpen your decision-making. Heat maps that display your performance by position, color-coded pot sizes, or dynamic charts that show hourly swings can all illustrate which aspects of your game deserve extra attention. For instance, a pivot chart might highlight that you rarely 3-bet from the small blind, prompting you to explore whether a more aggressive strategy could improve your overall results.
Moreover, by systematically exporting hand histories into your database, you can create specialized line graphs that compare your hourly rate across different limits, buy-in ranges, or game variants.
FAQ
Why is it important to track both live and online sessions separately?
Live and online games often have differing player pools, blind structures, and pacing. By separating your data, you get clearer insights into which format is more profitable and can tailor your strategies accordingly.
How do I maintain a steady methodology for noting down each result?
Decide on a consistent format for all sessions, using clear categories such as date, duration, limit, buy-in, and cash-out. Consistency helps prevent reporting errors and makes your data more reliable when you analyze it later.
Do I need expensive software to keep comprehensive records?
Specialized programs offer convenience, but you can replicate most analytical features with an Excel spreadsheet, free scripts, or phone apps. The key is consistency and accuracy in data entry.
How do advanced visualization features actually help me?
Visual aids like heat maps and dynamic charts reveal patterns you might miss in raw data. Seeing where you win or lose most often helps you adapt your strategy faster and more effectively.
Is it worth tracking intangible factors like mood or fatigue?
Absolutely. Emotions and energy levels can drastically affect your gameplay. Logging this data helps you see if sessions during certain moods or times of day are less profitable, allowing for strategic adjustments.
When should I consider moving up in stakes based on my records?
Look for a stable win rate over a significant sample of hands or hours. If your data shows consistent profits at your current stake and you have enough bankroll cushion, moving up might be viable. Always watch for changes in variance and ensure you keep collecting data to confirm your ability at the new level.
Can deeper analysis help with deal-making at a final table?
Yes. Tracking detailed figures for your play, such as how your equity stands against various short-stack or big-stack scenarios, can guide you in final table negotiations. Your historical performance under different stack depths can inform more favorable deal structures.
More Beginner Poker Tools:
-
- Rakeback 5%
- $55 Stake Cash + 260K Gold Coins
T&Cs Apply | Play Responsibly | GambleAware
18+ | Play Responsibly | T&C Apply
-
- 1,000 Chips Daily
- FREE 5,000 Chips
T&Cs Apply | Play Responsibly | GambleAware
T&Cs Apply | Play Responsibly | GambleAware
-
- 2,500 Gold Coins + 0.50 Sweeps Coins
T&Cs Apply | Play Responsibly | GambleAware
18+ | Play Responsibly | T&C Apply
-
- 150% up to 25 SC
T&Cs Apply | Play Responsibly | GambleAware
Terms & Conditions apply
-
- 5%
- 200% Gold on 1st Purchase
T&Cs Apply | Play Responsibly | GambleAware
Terms & Conditions apply


User Comments
There is a software package that does this for you. I own it and it works out well for me as far as tracking and charting my winnings (and losses!). Poker Session Manager 2 (pokermanager2.com). For the record I used Excel in the past but just found it too bulky to really see trends.
Dave, that depends on how fancy you want to get really. But basically you would need to start with two fields, start time and end time.
Either use date + time, or just time, but if you use just time you’ll need to use an if statement in your calculation to find when the end time is lower than the start time (past midnight, on to the next day).
The best way would be with dates, since everything would get messed up if you played more than 24 hours (it happens).
If you’re using dates + time, you can just subtract one from the other… sort of. read this, it might help:
http://www.cpearson.com/excel/datetime.htm
Can someone tell me how to do a fomula for “Start Time and End Time” so as to give the calculated total time in _hr_mins?
Thanks in advanced.
Paul,
There are a bunch of online stat trackers out there. I think some of them are free as well, but I can’t be sure of that since I don’t really use them.
Any report they can make, so can I. As a geek, I would rather do it myself.
I was thinking about making a database-driven web version of this, but then I stumbled upon PokerCharts.com. It seems to be fairly detailed and easy to use (from what I can see in the screenshots). Figured I’d post this here in case anyone wanted to avoid the Excel hassle.
Simon,
Hey, I’m glad that worked for you.
As for other stats, you can really make any stat you want. I actually built a whole spreadsheet with reports and graphs for this article (the reports and graphs are simple, just to give an example), but at the time it didn’t work out to provide that actual file.
But really anything you want to have happen, you can. I’m a fan of running reports to give results based on time-frame, limit, location, game type, ect.
Excel’s a much more powerful program than most people think. Technically you could build a spreadsheet which would tie into a Poker Tracker database to update automatically and run reports, allowing you to mix online and live results… but that’s a whole different ball game.
Worked Sean more than happy now, introduced an another “box” for Average/bb/hour overall which is nice too. If anyone wanted to add that the formula i easy,
=AVERAGE(CellREF:Cellref) i.e
=AVERAGE(B6:B19)
Cheers again:
P.S do you have anymore extra stats you can work out in Excel?
Simon,
The formula you’re using is specific to the formatting I used in the example.
$2-$5
The formula takes that and uses the “-” as the reference point to know what the big blind is.
For the formula to work you either need to replace all your limits from 0.05/0.10 to 0.05-0.10 or you need to change all “-” in the formula to “/”
that should do it for you.
(SUBSTITUTE(B7,”-“,””))))))/F7))
^^ all the formula didnt add in properly
tried the formula above cant get it to work even using the excel error editor.
error: #VALUE!
=PRODUCT((E7/(RIGHT(B7,LEN(B7)-FIND(“*”,SUBSTITUTE(B7,”-“,”*”,LEN(B7)-LEN(SUBSTITUTE(B7,”-“,””))))))/F7))
Thats what im using:
B7 = 0.05/0.10
E7 = difference in $ i.e ($23.4)
F7 = Hours (1.1)
anyone see anything wrong / wouldnt mind checking the excel file for me?
cheers
=PRODUCT((F2/(RIGHT(C2,LEN(C2)-FIND(“*”,SUBSTITUTE (C2,”-“,”*”,LEN(C2)-LEN(SUBSTITUTE(C2,”-“,””))))))/B2))
That’s the formula there. F has to be results, C has to be limits and B has to be hours.
If you can’t get it working just say so in a comment (make sure to use your real email). I’ll drop you a line so you can send me your spreadsheet, I should be able to fix it up for you.
I have a hard time getting BB/h working. it keeps saying “can’t accept input”.
Marikina,
You just need to get the sum of your results column. In my example I’m using F for results, if your spreadsheet is different, then you’ll have to replace F with the letter you need.
=SUM(F2:F300)
That will give you the sum of F2 all the way down to F300. Once you have more than 300 results this will break.
When you get to that point there are a few options on what you can do, but that’s a little more in depth.
The simplest way to deal with it is to save the spreadsheet for history, then add the full amounts (sums of all columns) as your first entry.
There’s more graceful ways to get it done, but they’re pretty in depth.
What’s the formula for Legacy Results?